

Everyone wants data-driven procurement, but few realise how quickly a badly-built category tree can turn procurement spend analysis into guesswork. Before we dive into the 17 Ways Not to Categorise Spend, let’s level-set the language:
- Spend classification is the process of tagging every invoice, P-card swipe, or expense line with a business-friendly label, IT Hardware, Facilities Services, Digital Ads.
- A spend taxonomy is the hierarchical map of those labels. Think of it as a controlled vocabulary that’s mutually exclusive, collectively exhaustive (nothing overlaps, nothing falls through the cracks).
- We lean on machine learning (ML), statistical models that learn patterns from historical transactions, to auto-assign categories at scale. Layered with simple rule maps (e.g., “Staples → Office Supplies”) and a human review loop, ML drives accuracy past 95 % without drowning analysts in manual coding.
- Finally, supplier-name standardisation merges aliases like “PwC,” “P.W.C.” and “PricewaterhouseCoopers,” ensuring volume-leveraging opportunities don’t stay hidden under three spellings.
Armed with these definitions, you’ll recognise why each misstep on the list hurts accuracy, inflates the “Miscellaneous” bucket, or distorts savings forecasts, and how to sidestep the trap before it sabotages your next sourcing wave.
1. Everything “Professional” Feels Like “Professional Services”
Fix Professional Services Overlap with Targeted Spend Categorisation Techniques
A legacy general-ledger often lumps legal advice, HR outsourcing, strategy consulting, and software implementation into one GL account called Professional Services.
When that GL is ported straight into your spend taxonomy, the category balloons to 30–40 percent of indirect spend, hiding leverage and inflating the “Other” bucket.
The remedy is functional segmentation, a spend-taxonomy development exercise that slices the mega-bucket into discrete, mutually exclusive leaves such as Legal Services, Talent & HR, IT Consulting, Management Consulting, and Other Advisory.
Each slice now has its own supplier market, pricing model, and sourcing cadence, enabling true procurement analytics software to benchmark rates, standardise statements of work, and negotiate bundled discounts.
Keep each Level-1 bucket below 20 percent of total spend; if one grows larger, split again. This approach aligns spend categorisation techniques with real stakeholder ownership, letting the CIO, CHRO, and GC each see “their” slice of professional outlay without wading through unrelated supplier noise.
2. Duplicate Buckets (a.k.a. IT Consulting vs Consulting – IT)
Eliminate Duplicate Spend Categories for Accurate Procurement Data Classification
Duplicate labels emerge when multiple teams translate the same supplier footprint into different naming conventions. A classic example: IT Consulting, Technology Advisory, and Consulting – IT all coexist, draining credibility from dashboards. Each bucket ends up 7–8 percent of spend, yet combined they outsized, signalling inconsistent rules rather than strategic diversification.
Fast repair starts with supplier-spend analysis: extract every vendor tagged to the competing buckets, then profile services and contracts. Invariably, overlap approaches 80 percent.
Gather stakeholders, CIO, Head of Apps, Digital PMO, and vote on a single, plain-language label that resonates enterprise-wide (say, IT Consulting & Advisory).
Add a one-sentence scope note and house it in your version-controlled taxonomy dictionary. Finally, redirect every rule and ML training label to the agreed code, then run a retro-classification pass on the last twelve months.
Overnight, duplicate buckets disappear, “Other” compresses, and confidence rises in all downstream procurement benchmarking metrics. Good governance keeps the clone from respawning during the next org shuffle.
3. Colour-Coding Pens (the Blue vs Black Ink Debacle)
Avoid Over-Granular Codes by Building a Streamlined Spend Taxonomy
Over-granularity creeps in when taxonomies are built directly from UNSPSC: the code set enumerates 44103103 Blue Ball-Point Pens and 44103104 Black Ball-Point Pens. Import those into your spend data classification model and dashboards stall under thousands of micro-codes worth $27.85 each.
The corrective lens is business intent. Ask: “Would a sourcing manager ever run two separate RFPs, one for blue pens, one for black?” Of course not. Collapse all SKUs for pens, pencils, highlighters, and markers into Writing Instruments. If analysts genuinely need colour drill-down (perhaps for carbon-footprint allocation), capture that detail in a custom attribute, not a category.
The result is a procurement spend analysis cube that aggregates meaningfully, loads faster, and still allows granular filtering. You optimise reporting performance, simplify supplier-rationalisation models, and preserve data lineage without drowning users in irrelevant choice. Remember: categories for decision-making, attributes for curiosity.
4. The “Amazon Means IT” Rule
Classify Business Lines Using Automated Spend Categorisation Tools
Rule-based maps often default to “Supplier = Category.” Works great for a pure-play toner vendor, fails spectacularly for Amazon Business, where a single invoice covers snacks, keyboards, and SaaS subscriptions. Tagging every Amazon line as IT Hardware distorts category totals and understates facilities or marketing spend.
Fixing this means multi-feature classification. Add description keywords (‘snacks’, ‘battery’, ‘USB-C’), unit-price bands (coffee pods rarely cost over $1, monitors rarely below $100), and cost-centre hints (Finance vs Engineering) into your training dataset. Your supervised ML model now learns that “USB-C Hub” belongs to Peripherals, while “Kitchen Towel” maps to Janitorial, even when both share Supplier = Amazon.
Complement AI with price-variance rules: if a line item from a multi-category supplier deviates ±30 percent from the average unit price in its predicted category, queue it for review. This hybrid approach embodies procurement data classification best practices, turning heterogeneous vendors from headache to hero in spend visibility solutions.
NOTE!
Some companies block Amazon Business entirely or funnel it through a punch-out catalogue that enforces line-level coding. In that case, supplier-based rules are fine because the catalogue already constrains the item universe.
5. GL Codes Masquerading as Categories
Translate GL Accounts into an Actionable Taxonomy for Strategic Sourcing Analytics
General-ledger accounts are built for statutory compliance, not strategic sourcing analytics. A GL called 5145, Outside Services may host marketing agencies, temporary labour, and elevator maintenance alike. Import GLs directly → unclear supplier segmentation → poor benchmark accuracy.
A practical solution is a mapping layer: one column for GL, another for the purpose-built spend taxonomy. Leverage procurement data mapping services or write a VLOOKUP/SQL join that re-assigns transactions based on supplier, cost centre, and keyword context. This decouples financial reporting from sourcing insight.
Downstream, finance still sees GL nets, while procurement tracks “Creative Agencies” vs “Labour Hire” in separate buckets, unlocking commodity-specific negotiations and category management without disrupting the chart of accounts.
6. Ignoring UNSPSC, Then Duplicating Effort for Regulators
Map Internal Buckets to the UNSPSC Taxonomy for Compliance & Benchmarking
Some organisations reject UNSPSC outright, only to spend weeks remapping when a shareholder ESG disclosure requires it. The smart play: keep one internal master taxonomy optimised for decision-making, but maintain a lookup table to UNSPSC (or NAICS/ANZSIC) so you can export regulatory views on demand.
Automated spend categorisation tools can generate both code sets simultaneously, preserving analytical clarity while satisfying compliance. The dual-taxonomy model is the backbone of modern procurement analytics software, sidestepping painful retrofitting and ensuring updates propagate to all reporting layers seamlessly.
NOTE!
Public-sector bodies in Australia/New Zealand often must record at UNSPSC level 4 during procurement. For them, UNSPSC isn’t optional; the “dual-taxonomy” advice still applies, but UNSPSC occupies a first-class seat.
7. Letting “Miscellaneous” Become a Dumping Ground
Shrink the Miscellaneous Bucket through Continuous Spend Data Analysis
“Other Services” starts at 2 percent but creeps to 18 percent within a year because no one refines edge cases. Establish a Miscellaneous threshold alert in your spend visibility solution: when any Level-2 bucket exceeds 5 percent of parent spend, it turns amber.
Analysts then review top 50 unclassified descriptions, form new leaves, and update rules/ML labels. Regular triage maintains collective exhaustiveness in your taxonomy and stops the CFO asking awkward “what’s in there?” questions.
8. No Supplier Normalisation
Boost Supplier Insight with Supplier Name Standardization Methods
If “Dell Inc.”, “DELL AUST”, and “Dell Technologies AU” all appear as separate vendors, volume rebates evaporate. Apply supplier-name standardisation methods using ABN lookups or fuzzy-string algorithms.
Once unique IDs replace free-text names, your procurement spend optimisation strategy can leverage aggregated volumes and negotiate pan-regional contracts. Normalisation also boosts auto-classification precision because supplier-to-category rules fire reliably for every alias variation.
9. Local Shadow Taxonomies
Enforce a Single Global Tree to Improve Procurement Benchmarking Metrics
Regional teams often tweak the global taxonomy, adding bespoke categories like “Snow Clearing Services”. While contextually valid, these changes break global roll-ups. Insist on a single master taxonomy, but allow local mapping tables that roll fringe leaves back into a sanctioned Level-2 parent. This preserves local nuance without corrupting enterprise-wide data procurement in big data analytics.
10. One-Size-Fits-Nobody Rules
Blend Rules and ML for Scalable Spend Classification Automation
Static if/then rules crumble when suppliers pivot offerings. Introduce self-learning ML that adapts to new descriptions and uses periodic retraining. Combine rules for high-precision lines (supplier = Staples) with ML for long-tail variance. This composite strategy meets procurement decision-making needs today and evolves with tomorrow’s catalogues.
11. Confidence Thresholds Set at 0.95
Set Optimal Confidence Thresholds to Maximise Automated Classification Accuracy
A 0.95 auto-approve bar leaves thousands of lines unclassified, burdening analysts and starving the model of feedback. Best practice: start at 0.80. Monitor false-positive cost; if negligible, hold steady. This balance maximises automated coverage while retaining a safety net for critical invoices.
NOTE!
0.80–0.85 is the sweet-spot for most organisations, but regulated environments (banking, pharma) sometimes insist on 90 %+ precision for high-risk categories. The trade-off is extra manual review. If your audit/compliance cost outweighs the extra head-hours, 0.90 can be justified.
12. Forgetting the Feedback Loop
Keep Models Fresh with a Monthly Feedback Loop in Procurement Data Analytics
ML models drift; new SKUs and suppliers phase in. Capture every analyst correction, reload into the training set, and retrain monthly. Automated pipelines from procurement data classification software make this painless, preserving 95 percent+ accuracy.
13. Missing Tail-Spend Sources
Capture Tail-End Purchases for Complete Procurement Spend Analysis
Tail spend, field-office credit cards, petty cash, may only be 5 percent but often hides compliance breaches. ETL every source, no matter how small, or risk flawed procurement benchmarking reports. Many spend data enrichment tools connect directly to card feeds, extracting merchant codes and boosting visibility.
NOTE!
If the tail is truly immaterial (<0.5 % of total spend) and cannot be influenced, cost-benefit may favour letting it ride. Just document the decision so auditors know the blind-spot is intentional.
14. Over-Granular Direct Materials Codes
Right-Size Direct-Materials Codes for Manufacturing Spend Optimisation
If each bolt diameter has its own category, dashboards overflow. Merge to Level-3 categories that mirror supplier market dynamics, “Standard Fasteners”, and let attributes store part-number specifics. Sourcing teams still see usable commodity views, while production planners retain granular data elsewhere.
NOTE!
In heavy process industries (chemicals, pharma) quality or traceability rules can require SKU-level categories because each bolt diameter really is treated as a different spec. In that scenario, granularity stays, but you still hide it from exec dashboards by rolling up in the BI layer.
15. Manual PDF Key-In
Replace Manual PDF Entry with OCR-Driven Procurement Data Cleansing Solutions
Typing invoice lines by hand introduces typos (“Healty & Saftey”) that cripple keyword rules. Implement OCR engines with post-extraction QA. Some procurement data cleansing solutions bundle OCR, NLP, and validation so text is production-ready before it hits classification.
16. No Date, Currency, or UoM Standardisation
Standardise Currency, Date & UoM for Reliable Spend Data Standardisation
Mixing AUD, USD, and EUR values in a AU$ dashboard distorts variance. Standardise via FX rates at transaction date, convert litres and gallons to a single unit, and adopt consistent date formats. These spend data standardisation techniques ensure apples-to-apples analytics.
17. Treating the Taxonomy as Finished
Schedule Quarterly Reviews for Ongoing Procurement Taxonomy Governance
Expansion into new services or M&A renders a static taxonomy obsolete in months. Set quarterly governance meetings to review category relevance, retire stale leaves, and add emerging spend areas.
Monitor drift KPIs, “Other” growth, unclassified percentage, to trigger proactive action. A living taxonomy sustains procurement cost-reduction strategies long after the initial go-live.
Cut these 17 errors from your process and watch your automated spend classification accuracy soar, ‘Other’ shrink, and strategic sourcing analytics deliver the margin the board keeps asking for.
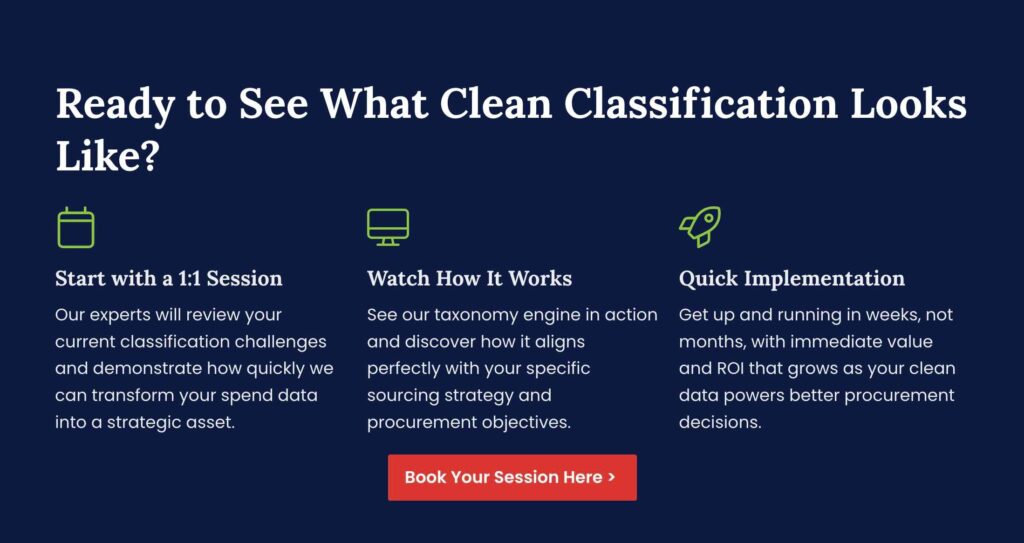
Next Step: Turn “Don’ts” Into Dollars
Ready to swap headaches for hard savings? See how Purchasing Index’s AI-driven engine cleanses data, applies your taxonomy, and locks accuracy above 95 %, all in a matter of weeks. Book a quick walkthrough and we’ll classify a sample of your spend live on the call.
Explore the solution and book a 30-minute walkthrough
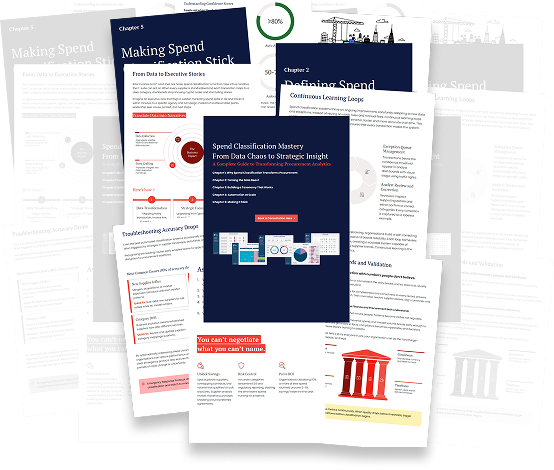
Dig Deeper: The Spend Classification Series
Ready to turn these “don’ts” into a complete, step-by-step playbook? Dive into our five-part Spend Classification Series and learn:
- Why Care?. the business case for spend data classification
- Our Data Is Too Messy!. cleansing and integrating five data sources into one “spend cube”
- Building a Taxonomy People Actually Use. designing an 8–12-bucket, MECE, three-level hierarchy.
- Human + Machine for Scale & Accuracy. layering rules, ML, and human review to hit 95 %+ precision.
- Implementation & Governance. a nine-step rollout and lightweight governance model that keeps “Other” tiny.